So, it happened to you. You were playing with Go’s AST or digging into escape analysis and realized that you need to know why Go compiler does what it does. There are many ways of achieving this: you can enable debugging flags or, for instance, read its source code. However, if these ways didn’t work well for you or you’re one of those who love to learn by doing, there’s one more way. You can interactively debug it. While it may sound complicated, you’ll soon see that there are only a couple of simple steps which lie between you and the world of compiler’s structures and interfaces. Ah, and of course you’ll need GoLand.
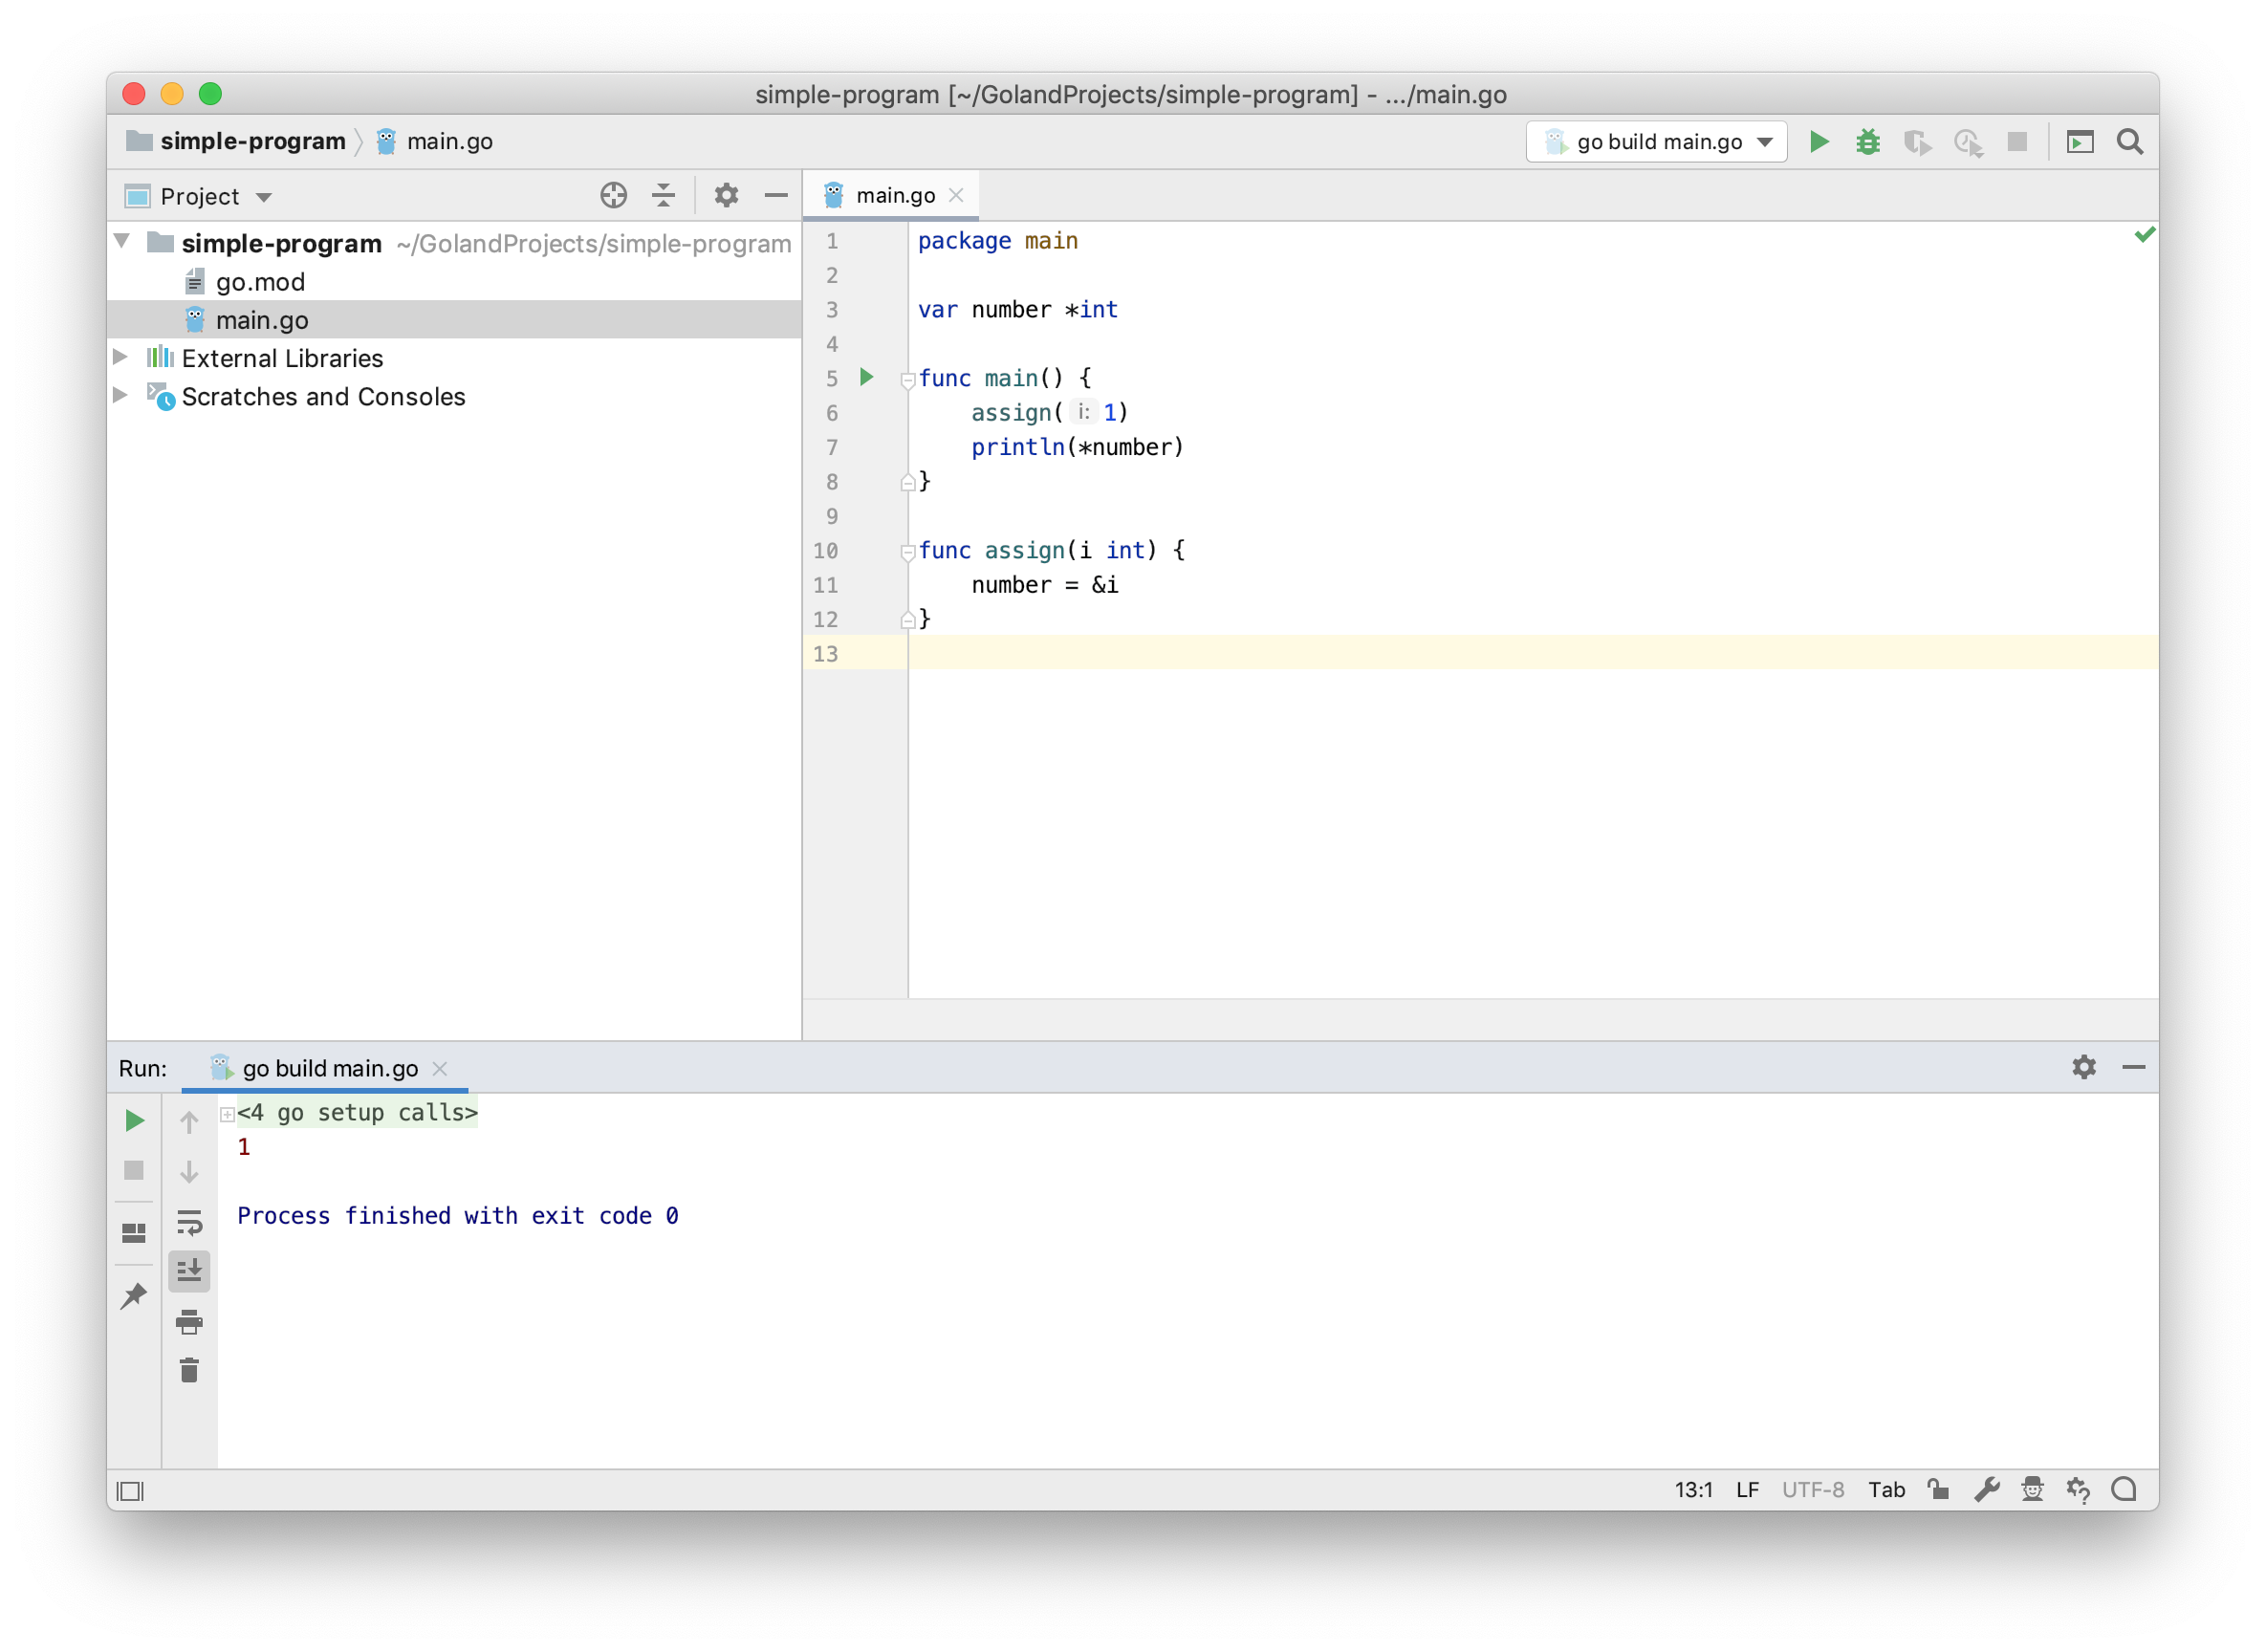
Let’s start with a simple program which stores an integer to a global variable and then prints the variable’s value. (Try to guess why I decided to go with this particular example. 😉 )
package main

var number *int

func main() {
	assign(1)
	println(*number)
}

func assign(i int) {
	number = &i
}
Unsurprisingly, it prints 1 when run.
Now, as we want to debug how it’s actually compiled, we need to switch to the Go’s codebase. I’m on the latest master which is currently at d56a86e0, but you might want to choose one of the release tags. Please refer to this article on how to clone and build Go SDK in GoLand. You only need to complete the first three steps, but it’s important to set GOROOT to the Go devel version.
/src/cmd/compile/main.go is the compiler’s entry point. Let’s open this file in the editor. At this moment, I need to mention that GoLand has so-called run configurations. They’re needed to tell the IDE how it should, well, run your code. The easiest way to create one is to click the green triangle next to func main() and choose Run … Last time I did it for my example program, but this time we should do it for the compiler itself.
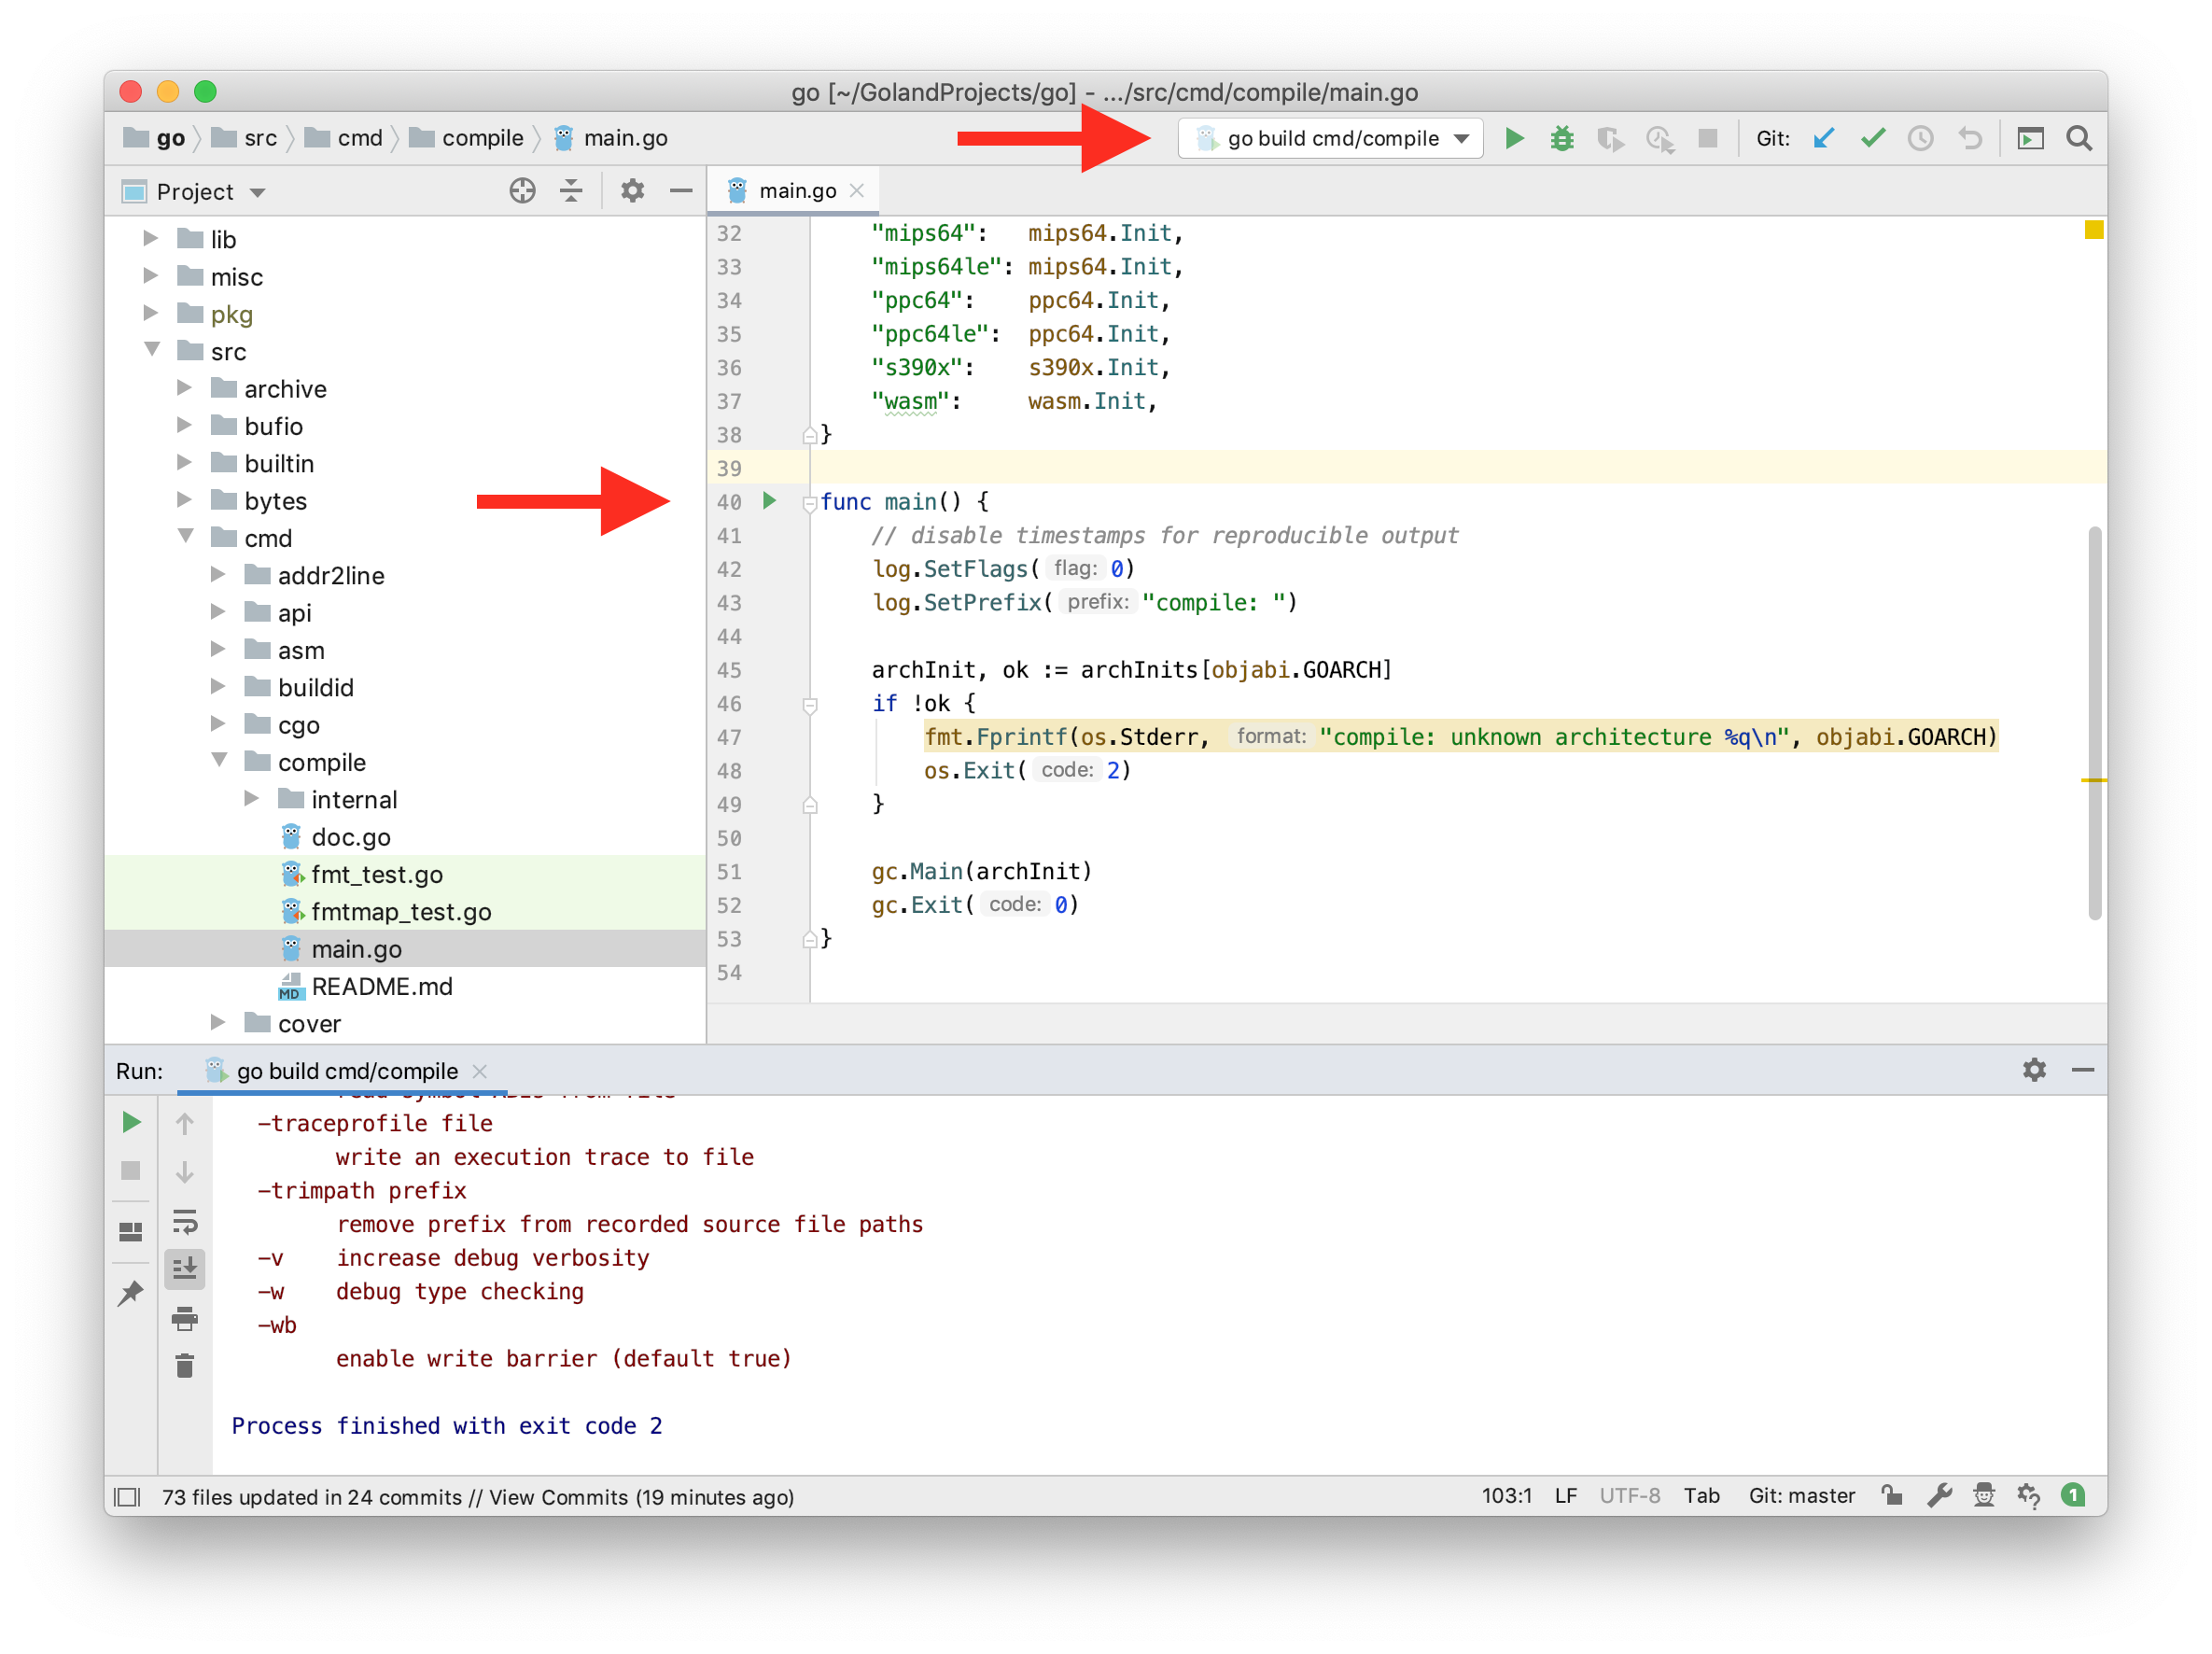
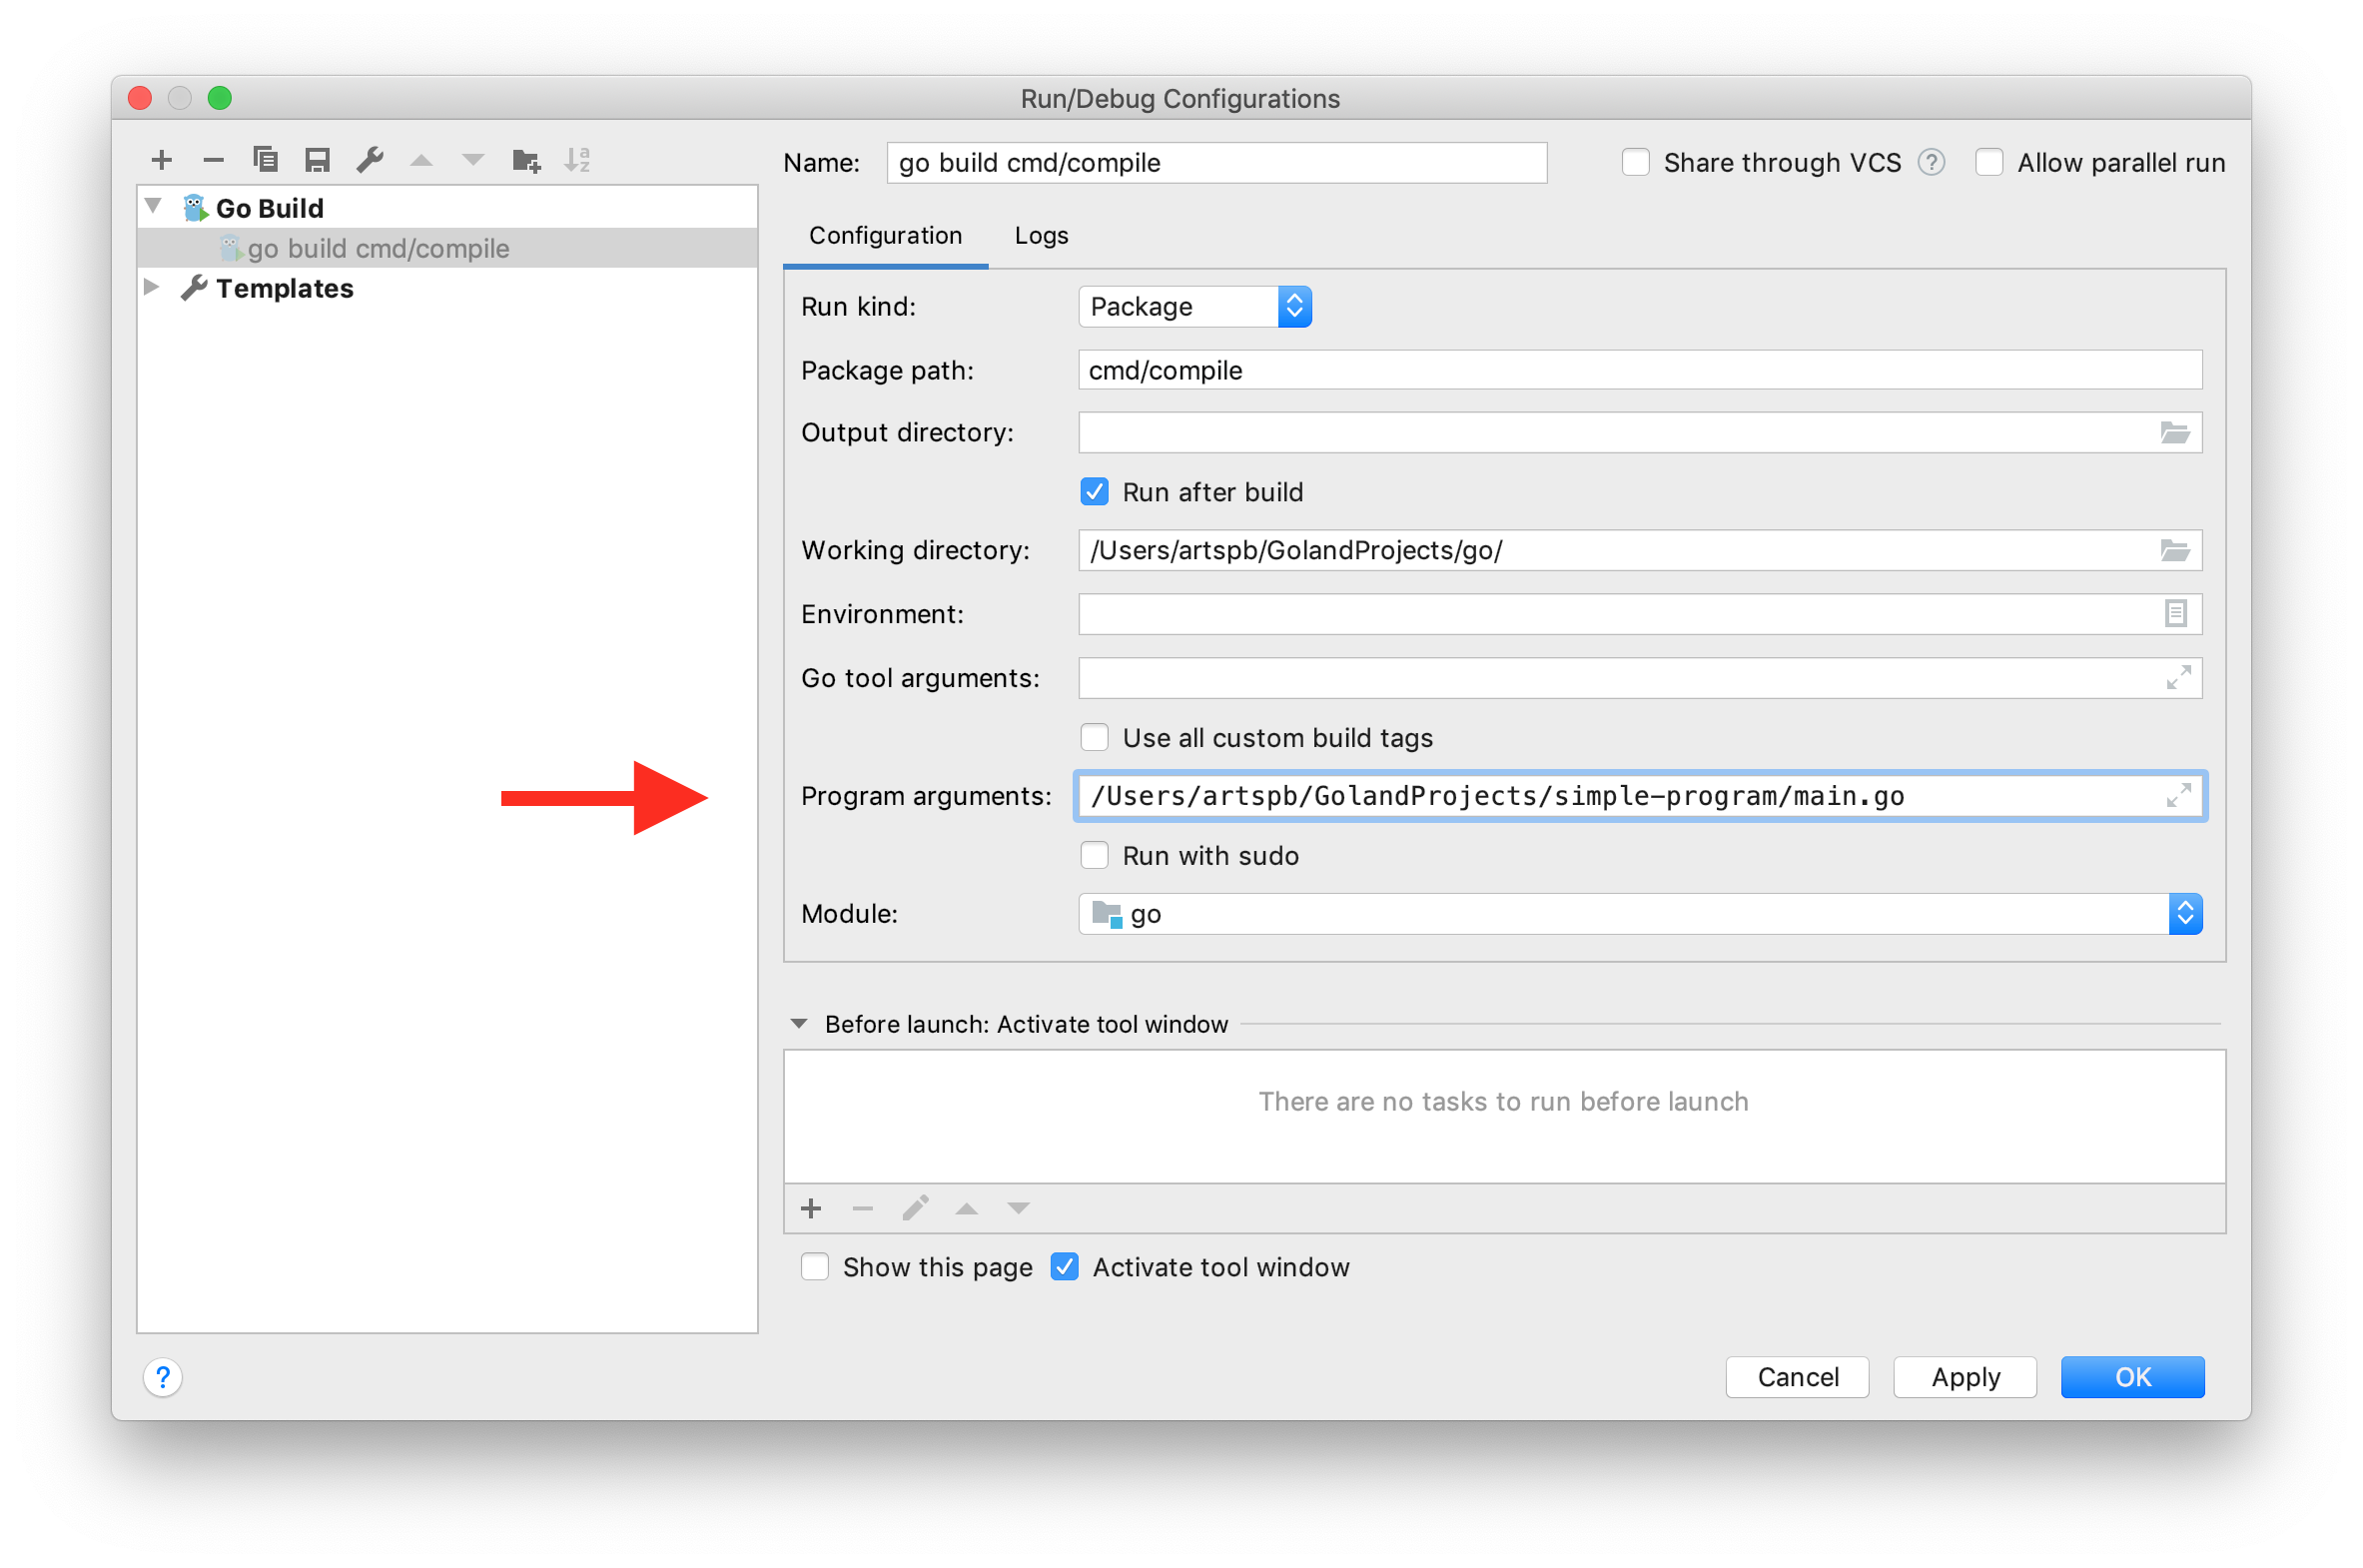
The compiler complains that we didn’t pass any parameters. It’s fine, let’s do it right now. In order to achieve it, we need to edit the newly created run configuration. One way of doing this is by clicking on go build cmd/compile at the top of the Navigation Bar. The only thing we need to do with the opened window is to provide a path to the file we want to compile as a program argument. That’s it; you can close it now.
There are only a few steps left. First, we need to set a breakpoint somewhere inside the main function. Second, we should use the green triangle again this time choosing Debug …
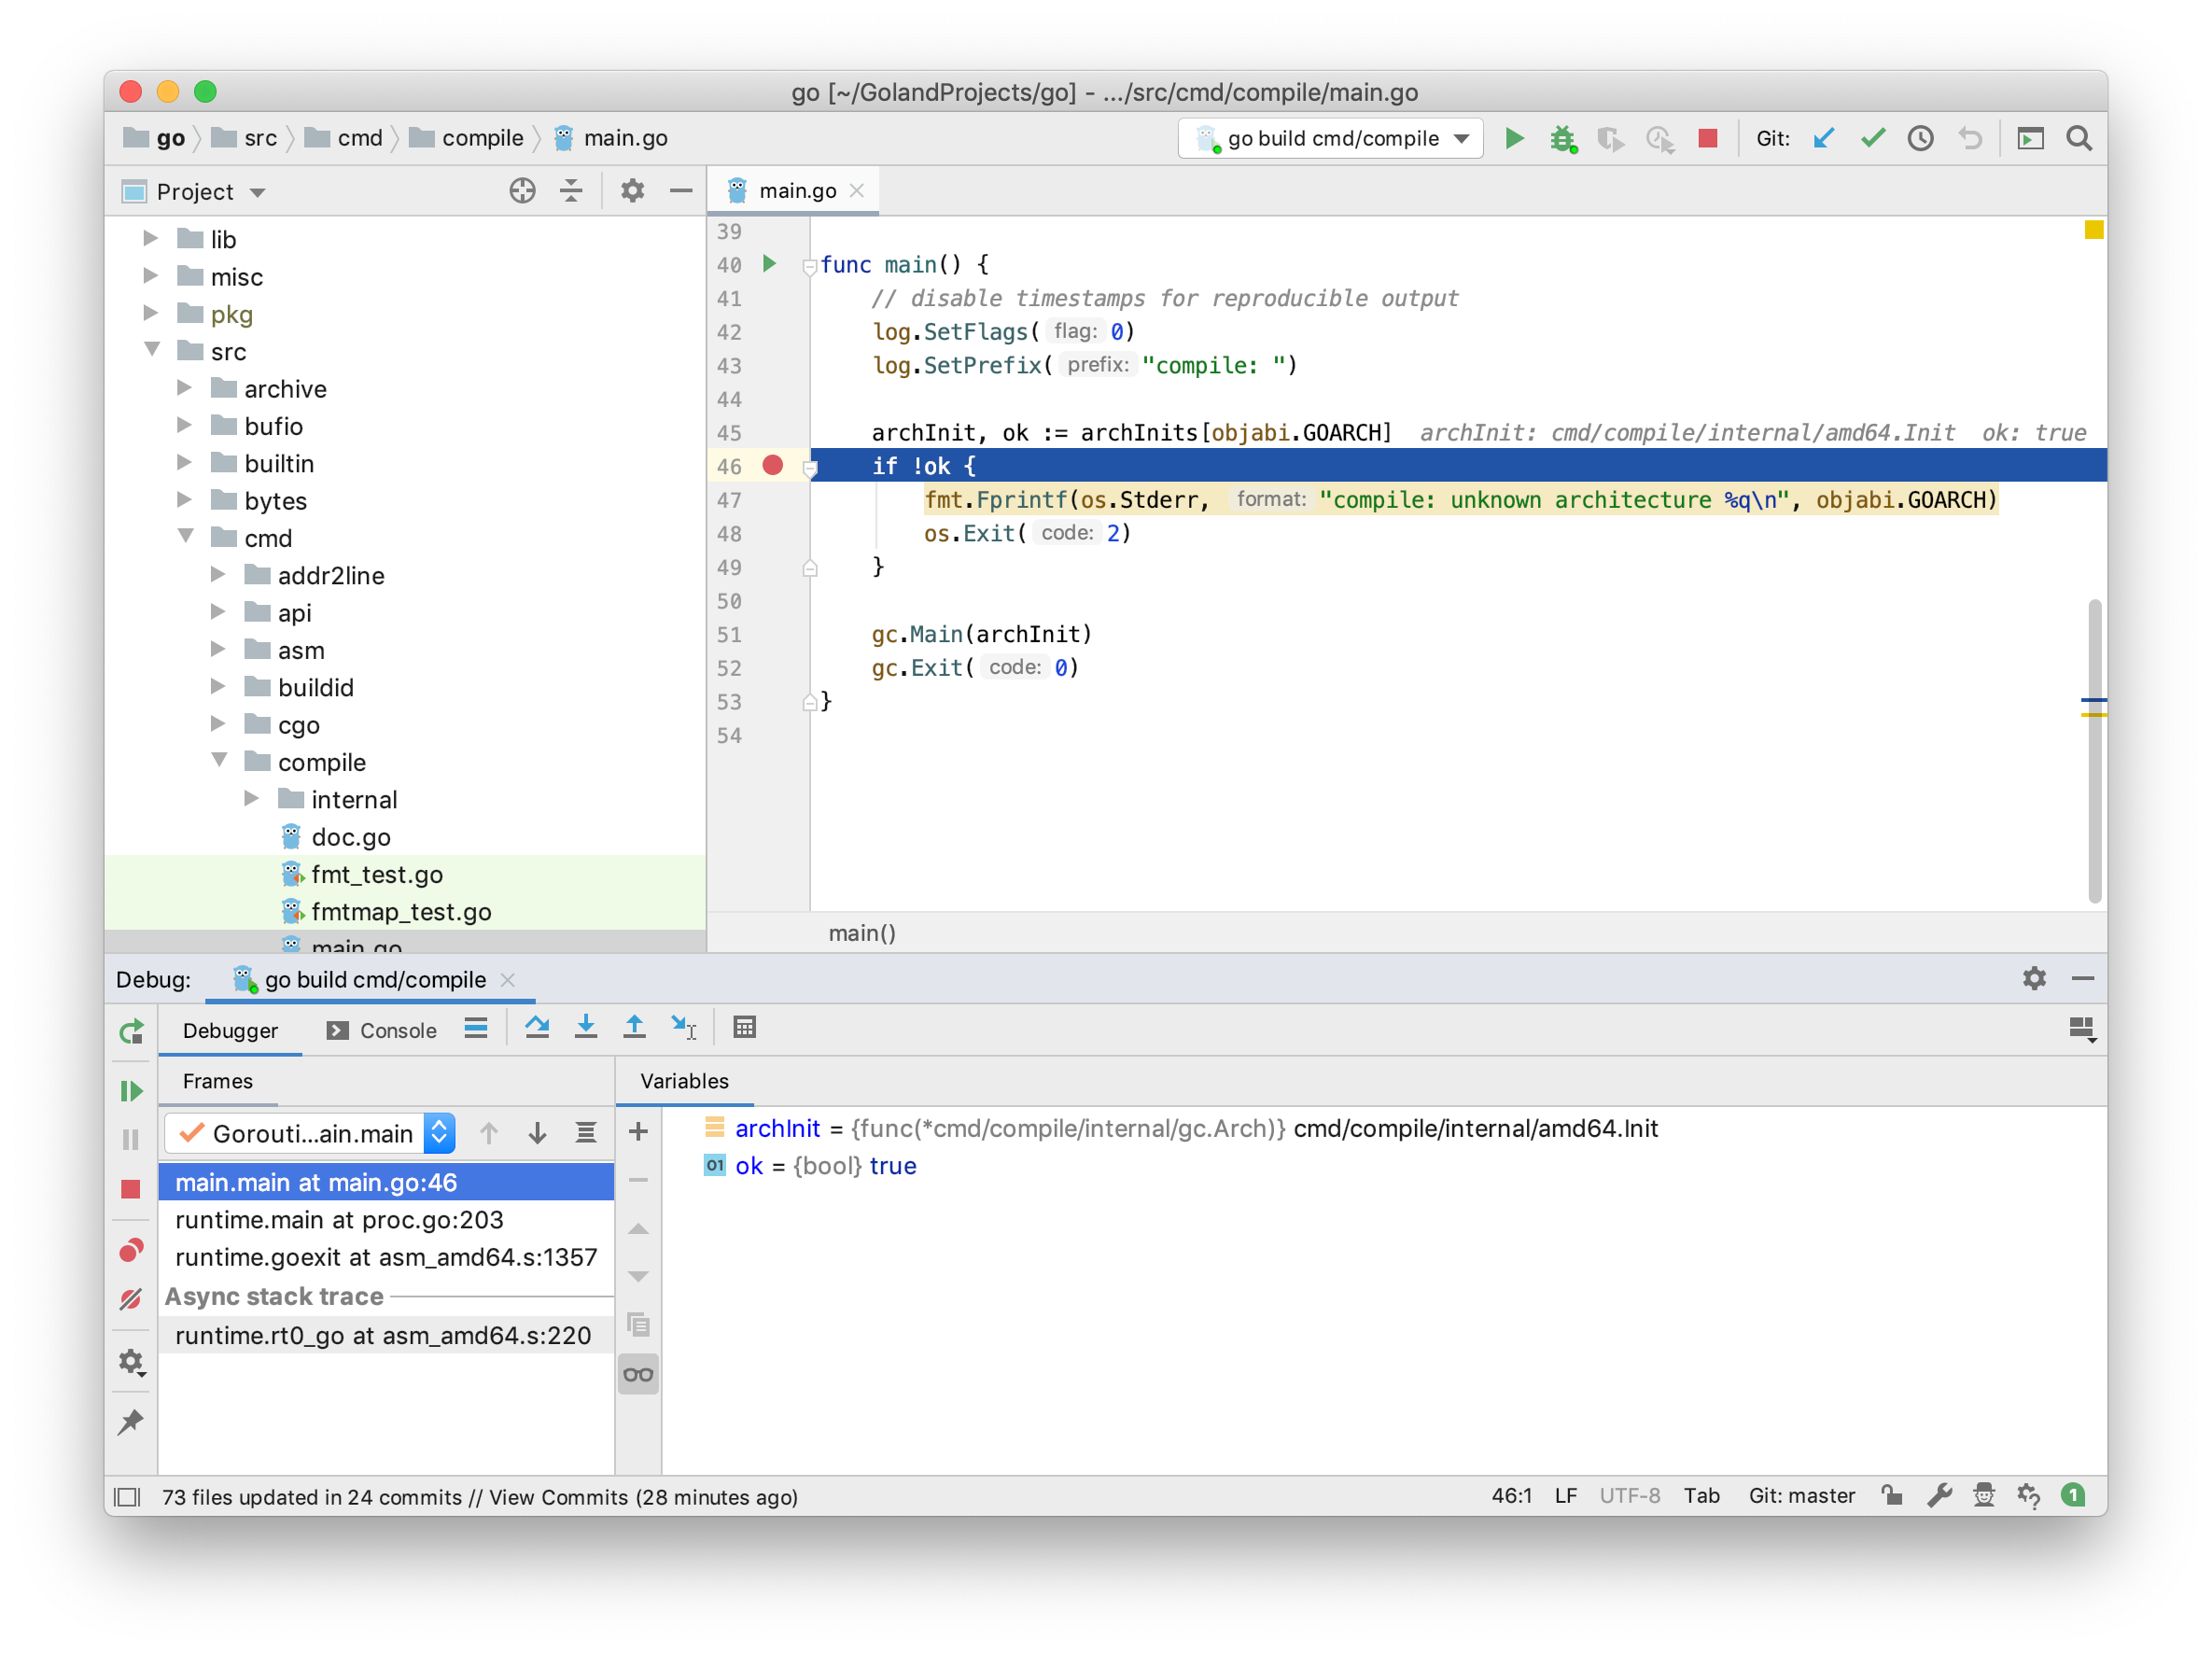
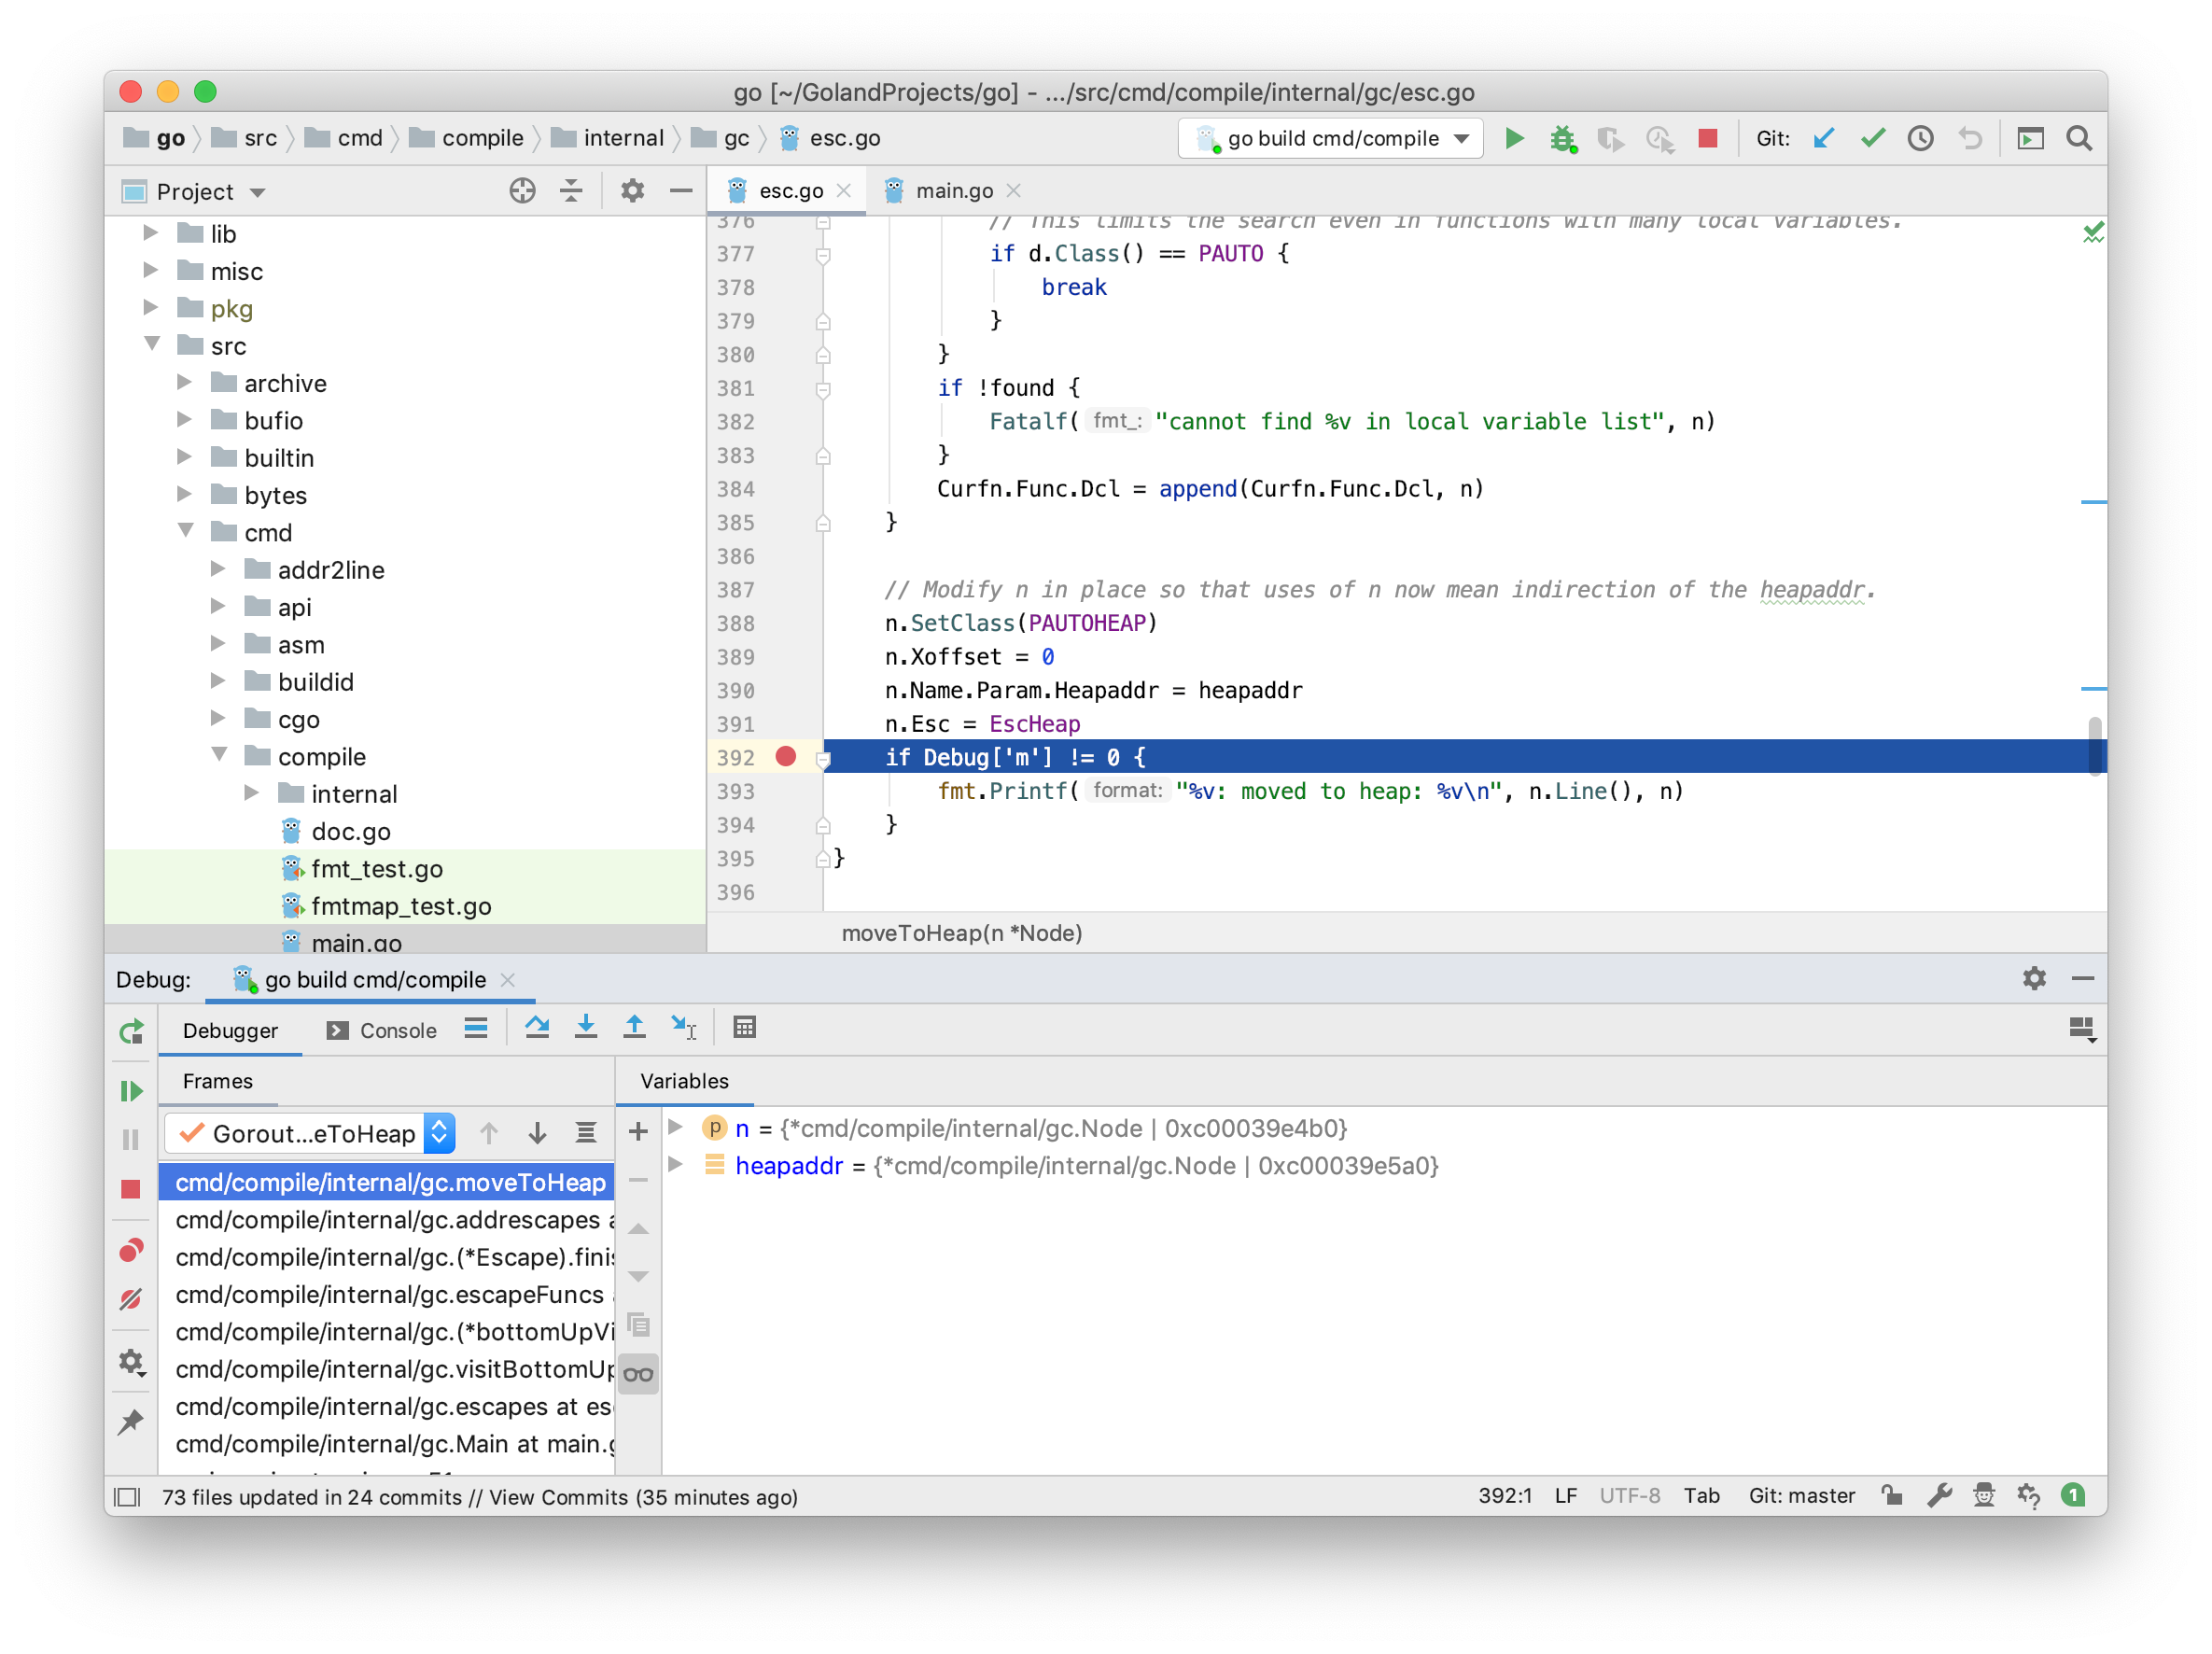
That’s basically it. You can now use the full power of GoLand’s debugger turned against the Go’s compiler. For example, you can debug the famous esc.go which is in charge of escape analysis. (You get it now. Right? Right? 😉 )
I decided to write this article because I always forget one step or another. But now I have this how-to and hope that it’ll help you as well. By the way, it’s inspired by the post from GoBridge’s forum.
Ever wanted to attach your dirty debugger to #golang compiler? Here's your tutorial on how to do it with @GoLandIDE. But please, don't post resulting pictures 😆 https://t.co/AQ03L5kJhH
— Artem Khvastunov (@art_spb) August 29, 2019